
Page 96 - Feasibility Study of New Media Technology on Constructing Online Public Sphere
P. 96
Feasibility Study of New Media Technology
on Constructing Online Public Sphere
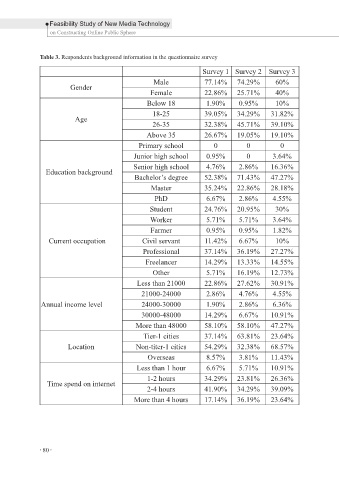
Table 3. Respondents background information in the questionnaire survey
Survey 1 Survey 2 Survey 3
Male 77.14% 74.29% 60%
Gender
Female 22.86% 25.71% 40%
Below 18 1.90% 0.95% 10%
18-25 39.05% 34.29% 31.82%
Age
26-35 32.38% 45.71% 39.10%
Above 35 26.67% 19.05% 19.10%
Primary school 0 0 0
Junior high school 0.95% 0 3.64%
Senior high school 4.76% 2.86% 16.36%
Education background
Bachelor’s degree 52.38% 71.43% 47.27%
Master 35.24% 22.86% 28.18%
PhD 6.67% 2.86% 4.55%
Student 24.76% 20.95% 30%
Worker 5.71% 5.71% 3.64%
Farmer 0.95% 0.95% 1.82%
Current occupation Civil servant 11.42% 6.67% 10%
Professional 37.14% 36.19% 27.27%
Freelancer 14.29% 13.33% 14.55%
Other 5.71% 16.19% 12.73%
Less than 21000 22.86% 27.62% 30.91%
21000-24000 2.86% 4.76% 4.55%
Annual income level 24000-30000 1.90% 2.86% 6.36%
30000-48000 14.29% 6.67% 10.91%
More than 48000 58.10% 58.10% 47.27%
Tier-1 cities 37.14% 63.81% 23.64%
Location Non-titer-1 cities 54.29% 32.38% 68.57%
Overseas 8.57% 3.81% 11.43%
Less than 1 hour 6.67% 5.71% 10.91%
1-2 hours 34.29% 23.81% 26.36%
Time spend on internet
2-4 hours 41.90% 34.29% 39.09%
More than 4 hours 17.14% 36.19% 23.64%
80
80