
Page 120 - 羊群效应调节机制下移动外卖App顾客持续使用意愿影响因素的实证研究
P. 120
羊群效应调节机制下移动外卖 App 顾客持续使用意愿影响因素的实证研究
——基于 TAM、ISSM 和 ECM 的整合模型
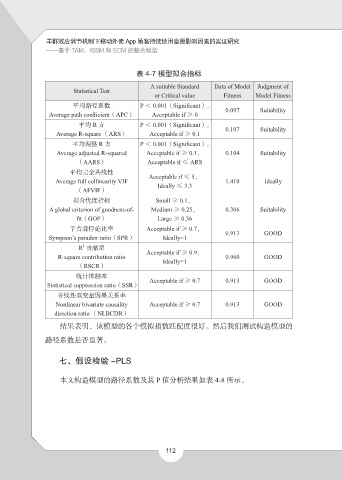
表 4-7 模型拟合指标
A suitable Standard Data of Model Judgment of
Statistical Test
or Critical value Fitness Model Fitness
平均路径系数 P < 0.001(Significant), 0.097 Suitability
Average path coefficient(APC) Acceptable if ≥ 0
平均 R 方 P < 0.001(Significant), 0.107 Suitability
Average R-square (ARS) Acceptable if ≥ 0.1
平均调整 R 方 P < 0.001(Significant),
Average adjusted R-squared Acceptable if ≥ 0.1, 0.104 Suitability
(AARS) Acceptable if ≤ ARS
平均完全共线性
Average full collinearity VIF Acceptable if ≤ 5, 1.410 Ideally
Ideally ≤ 3.3
(AFVIF)
拟合优度指标 Small ≥ 0.1,
A global criterion of goodness-of- Medium ≥ 0.25, 0.306 Suitability
fit(GOF) Large ≥ 0.36
辛普森悖论比率 Acceptable if ≥ 0.7, 0.913 GOOD
Sympson’s paradox ratio(SPR) Ideally=1
2
R 贡献率
R-square contribution ratio Acceptable if ≥ 0.9, 0.960 GOOD
Ideally=1
(RSCR)
统计抑制率 Acceptable if ≥ 0.7 0.913 GOOD
Statistical suppression ratio(SSR)
非线性双变量因果关系率
Nonlinear bivariate causality Acceptable if ≥ 0.7 0.913 GOOD
direction ratio (NLBCDR)
结果表明,该模型的各个模拟指数匹配度很好。然后我们测试构造模型的
路径系数是否显著。
七、假设检验 -PLS
本文构造模型的路径系数及其 P 值分析结果如表 4-8 所示。
112